Wednesday, July 31, 2013

Why QE hasn't stimulated the economy

After the Fed’s latest 2-day policy meeting it announced on Wednesday that it would continue its $85 billion per month asset purchase program.  The major indices fluctuated from positive to negative throughout the day, as is typical of a Fed meeting day, before closing basically unchanged.  

Many investors wonder why the Fed’s QE3 program hasn’t boosted the economy more than it has.  After all, $85 billion in monthly asset purchases would be, in a normal economy, inflationary.  This isn’t a normal economy, however, and as we’ve argued many times in past commentaries the deflationary long-term cycles which are down through 2014 is one reason why inflation remains subdued despite the Fed’s best efforts.

There’s another reason why QE3 hasn’t stimulated the economy to the extent that Keynesians would like to see.  It’s just possible, as one respected economist has suggested, that quantitative easing was never meant to be stimulative to begin with. 

Scott Grannis, a former chief economist at Western Asset Management and editor of the popular Calafia Beach Pundit blog, recently wrote that the primary objective of QE was to satisfy the world’s massive demand for money in the wake of the 2008 credit crash.  With the very real prospect of runaway deflation following the 2008 crisis, the Fed had no choice but to provide as much liquidity to the financial system as it possible could.  This, after all, is the prime object of the central banks as Grannis points out.

Cash is king in a deflationary environment, and following the credit crisis the demand for money exploded as investors liquidated stocks and commodities in a frantic bid to raise cash.  “Strong demand for T-bills began early in 2008,” observed Grannis.  “From late 2007 through mid-2008, the Fed sold almost its entire holdings of T-bills—about one-third of the Monetary Base—in an attempt to satisfy the world’s demand for safe assets.  But it wasn’t enough.”

That’s when bank reserves came to the rescue.  Reserves have since expanded to record levels and although banks are starting to lend again, most of that surplus money remains unused.  As Grannis puts it, “Bank reserves are the new T-bills, and that's why banks have been content to accumulate $1.9 trillion of ‘excess’ bank reserves (reserves that are sitting idle at the Fed, and not being used to support increased lending) since late 2008.
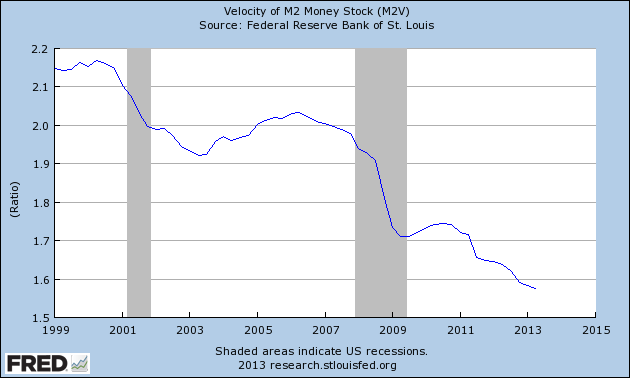
Notwithstanding the massive increase in bank reserves, money supply as measured by M2 hasn’t shown an inflationary increase.  Velocity of M2 is in decline and while a record amount of liquidity now exists, little of that money is seeing the light of day.  See graph below.


Indeed, the world currently holds 25% more money relative to total spending compared to six years ago, according to Grannis.  He observes that QE did nothing more than provide banks with the ability to support the public voracious appetite to hold more money.  The excess money created by the Fed, in other words, has been absorbed in a global savings glut fueled by fear and uncertainty over the future.  This is why QE hasn’t resulted in the major inflation that many predicted. 

True economic inflation, which is characterized by dramatically rising prices, wages and rising interest rates, only happens when the supply of money outstrips the supply of money.  So far that hasn’t happened due to the world’s continued high demand for money.  The Fed simply hasn’t been able to churn out enough money supply to exceed the public’s clamor for it.  This in itself is a testament to the deflationary undercurrents due to the Kress cycles.

Monday, July 29, 2013

Collapsing demand for municipal bonds

For three of the last four days there have been a plethora of new 52-week lows on the NYSE.  This disturbing increase of internal selling pressure comes at a time when a cluster of important weekly Kress cycles are simultaneously peaking and bottoming.  It also comes during the height of earnings season when stocks are vulnerable to headline disappointments.  Added to these obstacles is a still-rising interest rate trend which could add even more pressure to a market somewhat vulnerable to earnings volatility.

Most of the new lows were municipal bond funds.  While these bond funds have little to do with the broad market, it has long been my observation that the new highs/new lows are quantitative, not qualitative.  In other words, it doesn’t matter which kinds of stocks and funds are making new highs and lows; the quantity of stocks making new highs and lows is what counts.  So with a potentially dangerous number of new 52-week lows, there is every reason to be cautious in the next few days as the cycles remain in flux.

The Treasury Yield Index (TNX) bounced off its 30-day moving average last week and has been on the upswing for the past three days.  This reflects rising longer-term interest rates and is adding pressure to the municipal bond sell-off now underway.  It’s amazing when you consider just how many financial commentators and analysts were advising investors to purchase muni bonds and bond funds earlier this year.  This is even more amazing given the downward trend in the average municipal bond fund since last December.  The chart of the BlackRock MuniYIeld Quality Investment Fund (MFT) gives you some idea of the condition the muni bond fund market has been in for the last several months.


Municipal bonds were actually touted as “safe” investments for much of this year and even now, with investors heading for the exits, many analysts are advising investors to stand pat under the assumption that the sell-off was only "temporary."  Whether or not that’s true remains to be seen; what’s clear to be seen already is that rate-sensitive investments aren’t “safe” in a global economy made volatile by the crossing currents of the long-term Kress cycles (deflationary) and central bank intervention (inflation).  [Excerpted from the 7/24/13 issue of MSR]

Thursday, July 25, 2013

Factors behind gold's rally

Gold finally has experienced a long-overdue rally after what has seemed an endless decline through much of 2013.  The latest rally caught many traders short, forcing them to cover and thereby fueling the rally even more.  The growing list of bearish institutional banks growling against the yellow metal only strengthened the likelihood of a gold relief rally, as discussed in recent reports.

Gold traders have been bullish for four executive weeks according to Bloomberg.  Analysts point to the Fed Chairman Bernanke’s proclamation that he will prolong the stimulus if U.S. economic growth slows as the primary reason behind the rush to gold.  I disagree with this assessment since this theme has been a constant for the last several weeks and (until now) to no avail.  A more likely reason is the record “oversold” condition of the yellow metal according to the 10-month price oscillator (below).  A record build-up in short interest by uninformed traders is also fueling the latest rally.


The recent decline in gold prices revived sales of jewelry, coins and bars, according to Sharps Pixley, especially in China and Japan.  Concerns over near-term gold supplies have also helped push up the prices of the July futures above the August futures, according to sources.  In reflection of this, the cost of borrowing gold has risen to a four-and-a-half-year high in London.

Tuesday, July 23, 2013

Will stocks ignore the long-term Kress cycle?

Frequently I receive emails from clients who ask variations on the theme of the QE-driven stock market in light of the long-term Kress cycles.  For instance, one client recently wrote: “I really like your work but lately am struggling to piece together the longer-term direction.  You seem perpetually bullish, which has proven to be right, but am struggling to see what will change your mind to be bearish at any point.  Is it mainly liquidity that you see driving the market higher from here to the end.  Or the New Economy Index?”

My answer to this first question is that one can never underestimate the impact that liquidity has on pushing stock prices higher.  The Fed has committed itself to a policy of stock market recovery.  As the noted economist Ed Yardeni has opined the Fed’s “shadow mandate” is to support stock prices by means of its QE policy.  As another observer stated, “Never sell short a liquidity-driven bull market.”

It should also be mentioned that Bud Kress, the late cycle expert, emphasized that as long as there are no major long-term yearly cycles down for the year in question, there’s no reason to assume the Fed can’t engineer a bull market even in the face of the major structural problems facing the U.S. economy.  The next time a major series of yearly cycles will bottom is 2014.  Therefore there’s a very real possibility the U.S. stock market will be able to dodge another bullet in 2013 before the next set of long-term cycle bottoms arrive.

He continues, “If earnings continue to grow and liquidity is maintained, will this just override your 2014 bear thesis?”  To this I can only answer that earnings growth will eventually reach its limitation and will be hard pressed to continue expanding into 2014 with the long-term deflationary cycles in the “hard down” phase next year.  Already we’ve seen evidence that the all-important rate of change (momentum) of earnings is slowing down.

Another question: “When the departed Kress thought that if you artificially extend the cycles via direct intervention (i.e. the Fed), it may produce deeper ramifications down the line.  Is that possible here?”  I would argue that not only is it possible, but indeed likely due to the distortions the Fed’ endless QE programs are creating.   

Another question: “If you don’t see any problems amounting until end of this year or early next year, it all seems a bit too quick to bring about a deflationary cycle, does it not?”  Under normal circumstances I’d agree with this observation.  These aren’t normal times, however, and we’ve seen just how quickly markets can turn with the slightest provocation in recent years (e.g. the “Flash Crash,” Greece, Crete, et al).  If you go back to the last time the 120-year cycle bottomed in the mid-1890s, you’ll find that the stock market was in a roaring bull market right up until the start of 1893 – less than two years before the scheduled 120-year bottom in late 1894.  The panic of 1893 was swift, sudden and virtually without warning.  If it can happen once it can happen again.

Saturday, July 20, 2013

"Overbought" stock market in the balance

Probably the most important indicator of the market’s short-term overbought or oversold condition that I track is the 20-day price oscillator for the S&P 500.  The following graph shows the 20-day oscillator to be at an “overbought” extreme and has reached virtually the same level that turned back the market’s rally the previous two times this level was reached. 


I would emphasize, however, that an overbought market condition is much less reliable as a timing tool compared to an oversold condition.  Moreover, the market can remain overbought for an extended period – sometimes weeks at a time – before pulling back.  

I’d also point out that while the 20-day oscillator is at an extreme, there was at least one instance in the last two years when the oscillator was even more overbought – back in the summer of 2011 (see above chart).  It’s possible, then, that the market could become even more overbought before the next market-wide correction.

Thursday, July 18, 2013

Fed's loose money policy to continue

All eyes were on the Fed today as Chairman Bernanke testified in front of the House Financial Services Committee.  Bernanke indicated the Fed would maintain its loose monetary stance as long as economic indications warrant it.  He cautioned that asset purchases could be scaled back if economic conditions improve faster than expected  and inflation rises closer to the Fed's target of 2% inflation. 

Core inflation was down 1.1% on a year-over-year basis during the latest reporting month from a recent high of 2% in March 2012.  The core CPI, reported yesterday, was down to 1.6% in June, the lowest since June 2011. 

According to Bernanke, “low inflation is not good for the economy because very low inflation increases the risks of deflation, which can cause an economy to stagnate. It raises the real cost of investing, and the evidence is that falling and low inflation can be very bad for an economy.”  In other words, as long as the core CPI remains at or near all-time highs (see chart below), the Fed’s easy money policy will continue. 

Tuesday, July 16, 2013

Russia and the next oil crisis

On the global market scene, Russia has been one of the major laggards this year.  The Market Vectors Russia ETF (RSX), a reflection of the country’s stock market, fell 22% from its high earlier this year.  RSX was testing a three-year low not more than a month ago and seemed to be in danger of breaking below this major long-term support. 

Keeping in mind that the stock market is the single best barometer of future business and economic conditions, as per the old Dow Theory saw, things looked pretty bleak for Russia this summer…that is until the country caught a break from a major development in the commodities market.

Fortunately for Russia, the price of oil has been surging the last few weeks.  Russia’s economy is heavily influenced by the oil price due to the country’s reliance on oil and gas production and exports.  As goes the oil price, so goes the Russian economy, according to conventional wisdom.  It’s not surprising then to see Russia’s stock market rally in response to the recent oil price spike.

Russia’s gain, however, is America’s loss.  As the price of oil rises, it makes the cost of all fuels from diesel to gasoline more expensive.  In turn, as fuel costs rise the prices for all consumer goods eventually increase.  The gasoline price is a major factor in the U.S. economy and whenever gas prices become excessive it has negative repercussions for consumers.  Consider the long-term trajectory of the gasoline price since 2008: after the credit crash five years ago, the gas price has rebounded and isn’t far from its previous all-time high. 

The powers-that-be learned back in 1998 the folly of allowing oil prices to fall too low, for it nearly brought down Russia along with the rest of the global economy.  Since then we’ve seen a global subsidization of the oil price to artificially high levels, and most particularly in the price of gasoline.  Whenever things start to look bad for Russia, a rally in the energy markets always seems to come to her aid. 

You may also recall that the high oil and gasoline prices of mid-2008 were the final catalyst that touched off the economic storm of that year.  This isn’t to suggest that a similar collapse is brewing, only that the bull market and economic recovery will eventually be imperiled if fuel prices are allowed to keep rising.

A couple of useful barometers to watch in order to gauge the extent of fuel price pressures on the economy are the stocks of FedEx Corp. (FDX) and United Parcel Service (UPS).  FDX in particular is still holding up well, while UPS has taken a hit lately.  Rising fuel costs always weigh on these two key economic indicators and if FDX and UPS start to flag this summer, we’ll have a “heads up” that the fuel price increase will create problems for the economy. 

Monday, July 15, 2013

A "megaphone" pattern in the S&P

The story of the week was the new high in the S&P 500 Index (SPX).  The comeback of the SPX was remarkably fast, though this isn’t unusual given the historical tendency for the “megaphone” chart pattern visible in the index to bounce back quickly.  Last week we looked at a similar megaphone pattern in the SPX from the year 2005 and saw how quick and violent was the upside turnaround from this pattern (see chart below).


A similar pattern is playing out this time around with the S&P retracing all of its losses from the past six weeks and culminating in a token new high.  As I wrote in the July 3 report regarding the S&P: “A conservative drawing of the pattern’s upper and lower boundaries yields a 60-70 point upside target to roughly the 1,680-1,690 area, i.e. commensurate with the previous peak in May. 


A more liberal rendering of the pattern’s boundaries (as I’ve drawn here), would give us an estimated upside target of around 1,720 – admittedly extreme but not completely out of the question.”  Already the 1,680 minimum upside objective has been reached.  [Excerpted from the 7/12/13 issue of Momentum Strategies Report]

Friday, July 12, 2013

Institutional gold sentiment improves

Money managers on Wall Street are also beginning to have a closer look at gold after its record drop in June.  Hedge funds increased their gold purchases as signs of an improving economy drove prices lower in the longest slump since April.  According to CFTC data, money managers increased their net-long positions in gold by 9.9 percent to 34,301 futures and options contracts as of July 2. By contrast, holdings of short contracts climbed 1.4 percent to 78,148, to the second-highest on record. 

Meanwhile, the hedge fund Paulson & Co. reiterated its commitment to investing in bullion and stocks of gold producers to hedge against currency debasement as global central banks pump money into the economy, according to a Bloomberg report.  “Investing in the firm’s gold funds offers the 'potential for outsized returns' if investors have a long-term view,” according to a copy of a July 3 letter to investors obtained by Bloomberg News.  Fund manager John Paulson is among a handful of respected institutional-sized investors who are turning bullish on the yellow metal after its 13 percent drop in the past three weeks.

Holdings in global exchange-traded products backed by gold are down 24 percent this year and below 2,000 tons for the first time since 2010, according to Bloomberg.  This helped erase some $61.3 billion in the value of ETF assets.  Paulson is the largest holder in the SPDR Gold Trust, the largest bullion-backed ETF.  Total outflows from commodity funds were $834 million in the week ended July 3, according to Cameron Brandt, the director of research for EPFR Global, which tracks money flows.  Investors withdrew $636 million from gold funds, according to EPFR.  Thus the retail investing public has shied away from commitments in gold even as the “smart money” increases its bullish bets in the near term.

Wednesday, July 10, 2013

Gold searches for a bottom

While the bears continue to proliferate, there are also some respected professionals currently buying gold under the radar. One such example is Sebastian Lyon, the fund manager overseeing Personal Assets Trust, £600m investment fund whose overriding aim is to preserve shareholders’ capital.

Personal Assets Trust’s market-beating performance during the worst of the crisis was largely due to its big investment in bullion – currently more than 12 percent of its portfolio.  While the gold price has fallen in recent months, Lyon has topped up gold holdings, according to reports.  

The biggest entity of note to call for a short-term gold and commodities market bottom is of course Goldman Sachs.  Goldman’s long-term historical accuracy for calling market bottoms is unsurpassed among major institutions and provides a degree of confidence that the yellow metal is indeed close to a bottoming out point.  Goldman was joined by a bullish short-term call on gold a week ago by JP Morgan.


Various investor sentiment polls on gold show capitulation levels of bearishness, which increases the odds of a near-term bottoming process based on the contrarian principle.  Between the recent increase in bullishness among “smart money” players and the extreme bearish sentiment of the crowd, gold should be able to feed off these conflicting emotions and grind out a bottoming pattern in the coming weeks.

Tuesday, July 9, 2013

MSR trading performance for Q2

The second quarter of 2013 was largely profitable for most companies, although there was more stock market volatility in Q2 compared to Q1.  Q2 heralded the start of a narrowing phase for the stock market where stock selection becomes much more important than just buying an index ETF and holding. 

Following are the results of our stock/ETF trading recommendations for Q2 2013:

April 11: Bought PNM Resources (PNM) @ 23.61
April 17: Sold PNM @ 22.70 (stopped out)
April 18: Stopped out of PowerShares S&P 500 High Quality Portfolio (SPHQ) @ 17.28; bought at 17.08
April 26: Stopped out of Bristol Myers Squibb (BMY) @ 40.65; bought at 37.50
May 6: Bought Cree Inc. (CREE) @ 58.10
May 6: Bought Splunk Inc. (SPLK) @ 43.40
May 11: Took some profit in CREE @ 61.62
May 21: Took some profit in SPLK @ 46.49
June 4: Stopped out of SPLK @ 43.40
June 10: Bought Starbucks Corp. (SBUX) @ 65.66
June 24: Stopped out of CREE @ 60.00
June 24: Stopped out of SBUX @ 64.00


Monday, July 8, 2013

NEI probes an all-time high

The event of the week was the (almost) new high in the New Economy Index (NEI), which is now back to its previous all-time high of 103.80.  This was the level the index peaked out at on January 25 and hasn’t been revisited until now.

The recovery in the NEI after a 5-month period of consolidation is telling the story of continued economic strength in the U.S. retail economy.  The intermediate-term uptrend for the U.S. economy thus remains intact after the index threatened to break the trend some weeks ago.  NEI hasn’t given a confirmed economic “sell” signal in over three years.


Consumer optimism is most conspicuously reflected in the trend for auto sales, which has reached a multi-year high this year.  Sales of cars, light trucks and commercial vehicles are moving at a torrid pace this summer, which can be attributed to the economic and financial market momentum from late 2012/early 2013.  Rising interest rates – or the fear of higher rates down the line – are also a likely factor in spurring all kinds of big ticket purchases, from cars to houses. 

The performance of the New Economy Index in the last few years raises a question: can the NEI be considered as a leading indicator for the stock market?  There have been some notable instances of the NEI leading the stock market, both to the upside and the downside, in recent years.  I don’t believe a correlation can be established between NEI and the market, however, as several more years of performance history are needed (the index only stretches back to 2007).  Nevertheless, since NEI is comprised of the leading consumer/retail sector stocks, a breakout to a new high in NEI this week would carry bullish implications for the broad market.

Saturday, July 6, 2013

Why bank stocks are unconcerned by higher rates

Many analysts predict that banks will be hurt by higher interest rates.  Yet the best leading indicator of banks’ future profits – financial sector stocks – aren’t showing the slightest concern by this prospect.

Indeed, judging by the performance of the Bank Index (BKX) and the Broker Dealer Index (XBD), financial institutions seem to be quite at home with the idea of higher interest rates.  This, we are told by some experts, is because higher rates allow banks to loan more money.  Insurers also generate more returns on their investment portfolios with rising rates without having to rely on premiums. 


Despite the nearly 9% jump in the Treasury Yield Index (TNX) on Friday, July 5, bank stocks were up by an average of 2.62% while broker/dealers were up 2.39%.  Both the XBD and the BKX made new 52-week highs in contrast t the S&P 500, which is still below its previous high from May.


Rising rates aren’t good for everyone, however.  Homebuilders and REITs are struggling under the weight of higher interest rates, as can be seen in the daily chart of the Dow Jones Equity REIT Index (DJR).


Yet rising rates are providing a near-term boost to home buying.  As Dr. Ed Yardeni has pointed out, homebuyer’s initial reaction to rising mortgage rates has prompted would-be home buyers to close their deals as quickly as possible. 

Could it be that the reason for the bank stock rally despite rising rates is that banks are benefiting from the short-term stimulating effect of mortgage activity?  Once this wave of closings is completed, what then can we expect from bank performance?  I would venture a guess that the bottoming 120-year cycle in 2014 will suck the wind out of banks’ sails , thus defeating the expectation of increased loan activity.

Friday, July 5, 2013

Trouble brewing in China

The real economic and financial trouble spots in the world right now, however, are to be found primarily in Asia.  On Wednesday, a report showing slowing growth in China's service sector weighed on global markets. The National Bureau of Statistics reported that China’s services PMI, a measure of activity, had fallen to a nine-month low of 53.9 in June from May’s 54.3.  Although no major media outlet will come right out and say it, China is deflating.

The single best predictor of China’s business outlook is its stock market, and this can be seen in the relentless decline of the Shanghai Composite Index shown below.  China has actually been in the throes of a bear market for four years and this can only mean its economy will experience more turbulence in the months ahead.  If you were an odds maker and wanted to lay odds on where the next major economic crisis would begin, you’d have to point to China as being the most likely candidate.


Perhaps it is fitting, as tonight’s headline suggests, that as America prepares to celebrate its independence, it can still boast of being a bastion (relatively speaking) of economic and financial market stability.  Meanwhile chaos and uncertainty are increasing in other parts of the globe.  History tells us that sooner or later the world’s troubles inevitably end up on America’s shores, as it did in 1998, 2000-2002, and 2007-2008.  But until that fateful day of reckoning comes, the U.S. remains the undisputed leader among the global powers in terms of its buoyant equity market, strong corporate sector and firm retail economy.  [Excerpted from the 7/3/13 issue of Momentum Strategies Report]

Wednesday, July 3, 2013

Is inflation a good thing?

“Is there really such a thing as too little inflation?”  That’s the question the economists at Kiplinger recently asked.  For retirees living on fixed incomes or for business owners with limited control over the prices they charge, the answer to that question is an emphatic “no!” since inflation hurts them.

Monetary policymakers, on the other hand, remain steadfast in their belief that a contained amount of inflation is actually good for the economy.  As Kiplinger points out, the Fed reasons that “Businesses won’t hire more because consumers aren’t buying enough.  Consumers would buy more today if they feared that prices would go up tomorrow.  Plus fatter paychecks for those who get cost-of-living hikes typically spur more spending (even though income in real terms, after inflation, doesn’t change).”  They point out further that for businesses that don’t make cost-of-living adjustments to wages, real labor costs would decline, prompting additional hiring and income growth. 

What the Fed’s QE3 stimulus program really amounts to is an attempt at creating inflation through artificial means.  The classical definition of inflation is an economic condition characterized by rising wages, rising prices and rising interest rates.  Inflation is a product of the 60-year long-term/long-wave economic cycle.  When the cycle is in its peak phase there is inflation.  This is due to a combination of demographic, structural and monetary variables.  The last time inflation was truly a problem for the U.S. economy was in the late ‘70s/early ‘80s. 

When the 60-year cycle is in its descending phase, especially in the final few years of the cycle, there tends to be deflation to some degree or another.  The 60-year cycle is due to bottom late next year, which explains why the Fed has been unsuccessful in creating inflation in the face of the “hard down” phase of the cycle.  Although the Fed has been unremitting in its attempt at fighting deflation, it has found that overcoming the natural forces of economic nature is an impossible task.  The best the central bank has been able to do in the face of the long-term cycle is to cushion the blow and keep deflation from overwhelming the economy.

It might be argued that inflation is not a good thing, at least not during the deflationary phase of the Kress cycle.  Artificially raising the consumer price level can actually be quite destructive when the economy’s natural tendency is toward lower prices.  It hurts even more when wages are stagnant or declining on an adjusted basis and interest rates are near record lows. 

In the final analysis, the Fed will end up doing more destruction than good with its policy of trying to create inflation.  It would do well to let nature take its course and allow the forces of the long-wave cycle to cleanse the system of the imbalances and impurities created during the last 30 or so years.  Unfortunately, this will never happen due to the interventionist nature of bureaucracy.  

Be warned that when the 60-year cycle finally bottoms, the Fed is apt to get a lot more inflation than it bargained for in the years that follow.

Tuesday, July 2, 2013

Inflation’s shot across the bow

On May 3, the bond market fired the proverbial “shot heard ‘round the world.”  Treasury yields began a two-month climb to levels not seen in almost two years.  Many analysts proclaimed the end of the 30+ year interest rate decline.   The true significance in the yield rally isn’t that the long-wave deflationary trend in interest rates is over, however.  Rather, it’s that the commencement of long-term inflation is within sight.

While the rally in Treasury yields does have longer-term significance, it’s still far too early to assume the downtrend in yields is over.  As we’re still some 15 months away from the bottom of the 120-year cycle of inflation/deflation we can only assume the downward trend in interest rates remains intact.  Additionally, as real estate analyst Robert Campbell has pointed out, “until the actions of the Fed speak otherwise, Fed policy is currently working to push mortgage rates down.”

The rally in Treasury yields, while impressive, should be put into context with the longer-term yield trend.  Here’s what the Treasury Yield Index (TNX) looks like from the vantage point of a 2-year chart.  In this relative short-term chart you can clearly see the attempt yields have made in establishing a new rising trend in relation to the steep drop in 2011-2012. 


It’s only when we examine the long-term monthly chart of TNX that the true long-term trend becomes clear.  The downtrend line that can be drawn by connecting the yield peaks from 1996 through 2011 hasn’t even been broken yet.  The interest rate downtrend is therefore presumed to be still in force.  It likely won’t be until after October 2014, when the Kress mega cycle bottoms, that we’ll finally see this downtrend broken.


What then is the ultimate significance of the sharp rally in bond yields?  The spike in yields can only be appreciated by making historical comparisons with markets that behaved in a similar fashion.  For instance, gold was in a similar long-term downtrend from 1981 through 1999 when, in the autumn of ’99, the yellow metal unexpectedly launched a vigorous rally from its long-term low of nearly $250/oz. to a high of over $330/oz. in just a few short weeks (see chart below).  This wasn’t the official beginning of gold’s long-term bull market, which would actually begin less than two years later.  It was, however, an advance warning that a major change of gold’s long-term trend was in the making. 

Comparing gold with bonds isn’t as dissimilar as some may think, for both are excellent barometers of longer-term global liquidity and inflation/deflation expectations.  Of the two, interest rates are a more important indicator of inflation and deflation, so it will be especially important to monitory the interest rate trend in the coming months as we draw closer to the 120-year cycle bottom.

The ultimate meaning behind the short-term rally in Treasury yields can only be known with certainty after the facts have become clear.  It’s still far too early to discern what those facts may be.  Based on historical examples, however, it’s probable that the yield rally is a “shot across the bow” preliminary to the beginning of a new long-term inflationary trend starting in late 2014/early 2015.  

Monday, July 1, 2013

U.S. safe from overseas deflation for now

The selling pressure which hit stocks and bonds in June left the U.S. retail economy unscathed.  

Among the individual corporate stock components of the New Economy Index (NEI), which measures the real-time strength of the economy, only Wal-Mart (WMT) took a sizable tumble in June.  Monster Worldwide (MWW), the jobs component of the NEI, also plunged last month but its stock price accounts for only a small amount of the index.

Meanwhile Amazon (AMZN), EBay (EBAY) and FedEx (FDX) – the other important components of the index – are in varying degrees of health or recovery.  The signals reflected in the stock price performance of these three stocks alone are worth a hundred conventional economic indicators of the type relied on by mainstream economists. 

The NEI reading for last week was in line with the reading of recent weeks, viz. the NEI is still holding on above its 12-week and 20-week moving averages.  The interim uptrend for the index remains intact (below), therefore we still have a confirmed “buy” signal for the U.S. economy. 


Deflationary pressure is expected to resurface as we head closer to the final “hard down” phase of the long-term Kress cycle in 2014, but for now those pressures are confined mainly to Europe and Asia and haven’t yet appeared in the U.S.  The domestic retail economy, along with the consumer spending that supports it, is still firm.