Monday, December 30, 2013

Gold and the 120-year cycle bottom

Trading volume across all exchanges has been muted lately due to the holidays.  Traders are still mostly on vacation which has produced low volatility and a lack of excitement.  Not much is going on in the news front, either.

There was one news headline recently that was quite conspicuous, however.  A news site known as the Deccan Chronicle (www.deccanchronicle.com) published a story on Dec. 25 entitled, “Lift of import curbs may crash gold prices.”  The story was in reference to the Indian government’s proposal to relax import duties on gold.  Dharmesh Bhatia, of  Kotak Commodities Services Ltd., was quoted in the article as predicting a gold price crash if the Indian government removes the duties on gold imports or even relaxes the curbs significantly. 

Mr Bhatia said that Barclays Bank had stated that commodity-linked investment funds are headed for record outflows in 2013 and between November 2012 to November 2013, there has been a $88 billion decline in assets under management.  The article stated that investors had withdrawn $36.6 billion from commodity funds during this period due to the decline in prices of sugar, coffee, nickel, gold, silver, and other resources.  By far the biggest decline, however, was witnessed in gold, with a 29 per cent crash after a rise over nearly 11 years.  EPFR global estimated that investors have withdrawn $38.8 billion investments from gold funds alone.

“While there is no indication that government is in any hurry to left the ban on gold imports,” the Deccan Chronicle reports, “there has been a demand from the Union commerce and industry minister Anand Sharma for relaxing the curbs on gold imports.  Even the Reserve Bank of India governor Raghuram Rajan is of the view that if curbs on gold imports continue.  It would incentivize smuggling.”

Experienced investors know that when the word “crash” appears in a headline it typically carries a contrarian implication.  It should further come as no surprise that this highly charged emotional word is prominent after a stock or commodity has experienced a steep decline.  Could the appearance of a crash warning for gold signal the metal’s imminent reversal?  Perhaps, although a more likely interpretation is that gold has reached – or nearly reached – a temporarily “oversold” technical condition and is primed for at least a short-term technical rally. 

We still need to see gold close at least two days higher above its 15-day moving average, and for the 15-day MA to turn up.  This will provide the technical context for an immediate-term bottom and short-covering rally based on our technical discipline.  A corresponding decline in the U.S. dollar index would increase the likelihood that an immediate-term breakout signal in gold won’t prove to be a false signal.  For now the immediate-term trend for gold remains down as defined by the position of gold’s price line to the 15-day moving average (see chart below). 

Wall Street’s reaction to the Fed’s taper announcement at its December meeting was interpreted by many as a vote of confidence for the U.S. economy.  The resulting rally in stocks and subsequent decline of gold’s value would seem to justify this view.  As I’ve argued in these pages, what’s good for stocks is bad for gold and until something comes along to upset investor confidence in the economic and/or stock market outlook the bear market in gold is likely to continue. 

Gold is in need of a catalyst to launch a revival of its fortunes.  The year 2014 is the best bet for such a revival due to the influence of the major long-term yearly cycles scheduled to bottom later next year.  A return of broad market volatility and global economic uncertainty would be the most likely candidates.  

Speaking of the long-term cycles, a reader shared with me the following scenario: “Could it be that the gold and precious metals markets are reflecting the hard done phase of the Kress cycles?  The action in gold the past few years is certainly consistent with what one might expect in the final sharp decline of the long term cycles.  In fact, the action of silver might have been the best harbinger of the concomitant decline in the fall of the middle class over the second thirty year period. 

“As you know, silver peaked in 1980 around $50/oz fairly close to the peak of the first half of the 60 year cycle.  Setting up the hard down phase in the Kress cycles in 2011, silver failed to take out its 1980 high just under the $50/oz level. The middle class was teased, with silver flirting with its 1980 high, camouflaging the massive decline in purchasing power the last 30 years has wrought.  Furthermore, the collapse in the silver price since 2011 has the potential on an inflation adjusted basis to challenge the 89% stock market decline witnessed during the early stage of the Great Depression. 

“It might be that this time the 120 year cycle bottom coincides with the bottom in the precious metals bear cycle.  Perhaps the stock market does not have a harsh decline until interest rates accelerate higher with the initial lift from a new 120 year cycle?”

My answer: This is thought provoking, and perhaps you’re right that gold/silver will bottom out, long-term, in late 2014 with the 120-year cycle.  As far as gold and silver bearing the brunt of the cycle, I’m not so sure.  The Kress cycles are primarily equity cycles and secondarily economic cycles.  I don’t think Mr. Kress would have agreed gold and silver are primary recipients of the final “hard down” phase.  Considering that gold is inflation/deflation sensitive, however, it’s likely that the metals are experiencing a spillover effect from the cycles, however.   
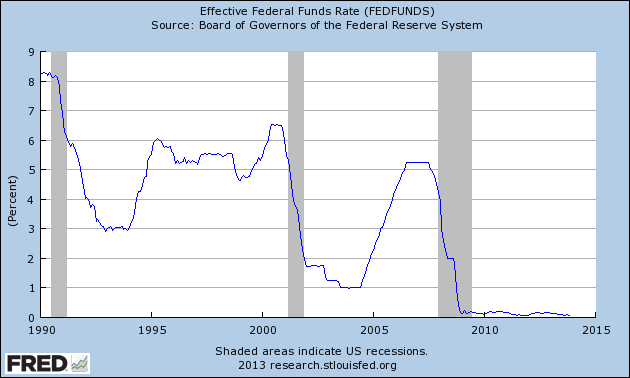
The main effects of the deflationary cycle, IMO, can be seen in the economic numbers: despite record levels of liquidity generated by the Fed since 2008, unemployment has dropped only slightly and inflation remains below 2%.  What else other than the 120-year cycle of inflation/deflation can explain this?

Sunday, December 29, 2013

A look at investor sentiment

The latest spike in the bullish percentage is another in a growing list of evidence that the market is becoming increasingly vulnerable to a correction.


Also keep in mind that according to Investors Intelligence, the percentage of bullish newsletter writers has increased to a 3-year high while the percentage of bears recently hit its lowest reading since prior to the 1987 market crash.  As I wrote in Monday’s report, “A one-sided, bull-dominated stock market is a top-heavy one and is quite vulnerable to unexpectedly bad news.”  After the ebullience of the year-end, end-of-quarter portfolio adjustment inspired rally has subsided, investors are apt to consider the influence that rising rates might have on equities. 

A corrective pullback in January need not put an end to the bull market, however.  A final “melt-up” in the first quarter before volatility significantly increases is still my working scenario entering the New Year.  

The next stock market pullback might be a short-but-sharp affair like the one in November 2010.  A pullback would clear the air and remove some of the speculative excess from stocks in preparation for the final run-up.  [Excerpted from the 12/27/13 issue of Momentum Strategies Report]

Monday, December 23, 2013

A melt-up, then a melt-down in 2014

Market events such as crashes and panics are thought by economists to be random, unpredictable events.  To the contrary, such events are nothing if not predictable and often arrive with recognizable regularity.  A cursory examination of the last few decades will prove this to be conclusive.

Writing in Barron’s, Randall Forsyth pointed out that each cycle of 40-years plus “has been marked by blowups.”  He cited the following debacles: Penn Central (1970), Herstatt Bank (1974), the Hunt Brothers (1980), the October 1987 crash, the S&L crash (1990), the mortgage securities and Mexican crises of 1994, the emerging-market debt crises of 1997-98, the dot-com crash of 2000, and the housing crash of 2007-08. 

“Two things stand out” from these crises, writes Forsyth: “The calamities escalated in scale.  And each came during or at the end of a tightening cycle by the Federal Reserve.” 

Forsyth’s observation that financial crises have increased in magnitude since circa 1974 is a testament to the increasing strength of the “winter” phase of the Kress 120-year cycle.  The periodic market crashes of each decade since the 1970s have progressively worsened due to this acceleration of deflationary pressure exerted by the long cycle. 

The 120-year cycle is a composite cycle, which means it has multiple components.  Arguably the most dominant of these components is the 40-year cycle.  There are three such 40-year cycle bottoms within a complete 120-year cycle.  Each previous 40-year cycle was accompanied by a significant market event or economic crisis.  It would be highly irregular if 2014 didn’t witness a discernible setback of some sort with the 40-year cycle bottoming later next year.

Incredible as it may sound, we’re one of the lucky few generations that get to witness the momentous changes wrought by the 120-year cycle bottom.  The discoverer and exponent of this cycle, Samuel J. Kress, called it the Revolutionary Cycle.  This long-term cycle of inflation/deflation is always characterized by revolutionary changes, either social or economic in nature, and the last such generation to witness a revolutionary cycle bottom was in the 1890s.  It was that generation that saw the revolutionary change in the U.S. away from an agrarian economy and towards an industrial one. 

Financial and economic crises typically set the stage for social and political changes of a revolutionary character.  It isn’t for naught that the 120-year cycle is known as the Revolutionary Cycle. 

The late Mr. Kress fervently believed that the upcoming 120-year cycle bottom in late 2014 would witness the demise of free market capitalism and the beginnings of a full-fledged socialist political revolution in the U.S., and he wrote extensively concerning this.  With the upcoming implantation of State-mandated universal health coverage – right on schedule in 2014 – it would seem that Mr. Kress’ prediction was on target. 

The set-up for a market melt-down in 2014 as the 120-year cycle bottom draws closer is the developing “melt-up” in the weeks and months ahead.  Pushed higher by a floodtide of share buybacks and concentrated institutional buying interest in a select few shares, the major indices have defied the bearish pronouncements of analysts and letter writers for most of 2013.  With their backs to the wall, these erstwhile bears are slowly admitting defeat and have begrudgingly joined the ranks of the bulls.  This trend will likely accelerate into 2014 before the market encounters turbulent waters later in the year.

When there is near unanimity of opinion about the stock market’s direction, the bulls will be faced with a serious challenge.  A one-sided, bull-dominated stock market is a top-heavy one and is quite vulnerable to unexpectedly bad news.  The bad news for 2014 could be an anticipated hike in the Fed funds rate, an economic slowdown in China or trouble in euro land.  This is when the downside pressure of the long-term cycle bottoming will inflict maximum damage. 

On the institutional front, Goldman Sachs analyst David Kostin is one of the very few dissenters from the super-bullish consensus among analysts making 2014 forecasts.  He rightly points out that the market hasn’t suffered a serious decline in two years and is ripe for one in 2014.  “We had a 40% rally in the past 18 months with no correction,” he recently told Barron’s.  “It’s hard to identify why, but an increased probability of a correction next year is worth emphasizing.”  Unlike most Wall Street institutions, Goldman tends to be on the leading edge of critical market junctures.


Also worth noting is the research by Ned Davis which shows that mid-term election years (i.e. the second year of a presidential term) show an average decline of 21% going back to 1934.  “But,” adds Davis,” “after the low was hit in those years, the market, on average, gained 60% over two years.  So a correction [in 2014] should be followed by a great buying opportunity.”  This assessment jibes with the 120-year Kress cycle view which suggests a major bounce-back following the cycle’s bottom in late 2014. 

For now the bulls still carry the day on Wall Street.  Look for this state of affairs to reverse at some point in 2014 after the last of the bears have capitulated and joined the bulls.  Indeed, the anticipated revolutionary changes produced by the upcoming 120-year cycle bottom may well begin with a revolutionary change in Wall Street’s sentiment profile.

Saturday, December 21, 2013

Strength in Fed-Ex

As discussed in previous reports, one of the most important stocks reflecting the overall strength of the U.S. economy is FedEx (FDX).  I had previously expected a move above $140 by year-end in FDX, which I suggested would confirm the strength in the U.S. retail economy for the holiday shopping season. 

As you can see in the following graph, FDX finally succeeded in breaking above the $140 level on Friday, closing at a new high of $142.71.  As I wrote last week, “I expect a nominal move above $140 before the year is through, and assuming this happens it would most likely provide a buoy for Wall Street’s year-end enthusiasm.  It also might just be enough of a catalyst to keep the market uptrend intact heading into 2014 and thereby keep our Q1 2014 ‘melt-up’ scenario intact. 


The latest rally in FDX is clearly sending a green flag for the overall business economy with strong undertones for the strength among the retailers.  [Excerpted from the 12/20/13 issue of Momentum Strategies Report]

Wednesday, December 18, 2013

The dollar’s demise and the rise of Bitcoin

One of the questions investors have been asking lately concerns the outlook for the U.S. dollar index.  Investors are understandably concerned by the dollar’s weakness and worry that perhaps that any notable increase in inflation could lead to further erosion in the dollar’s value.

In a weak dollar environment, investors actively search for alternatives to cash which provide growth and relative protection from dollar weakness.  Until 2011 the investment safe havens of choice were gold and silver; prior to that it was real estate.  The new alternative investment versus the dollar is growing in popularity and becoming more widely accepted as a legitimate financial vehicle.  I’m referring to Bitcoins, the open-source, peer-to-peer payment network and digital currency.

Bitcoins made news recent when the People’s Bank of China announced that it was prohibiting Chinese financial banks from accepting Bitcoins as legal tender currency.  The announcement caused a 20 percent drop in the value of Bitcoins, though the value later rebounded.  Bitcoins have been one of the big financial success stories of the year, and the continued increase in the coin’s value has prompted speculation that a “Bitcoin bubble” has developed.

Randall Forsyth, writing in a recent Barron’s column, nailed it down when he wrote: “Clearly, [Bitcoin] is a speculative vehicle for the masses.”  Another Barron’s writer, Michael Kahn, likened Bitcoin’s bull market to the tulip mania of 1637.  “The dangers of buying into a bubble,” he wrote, “are the same as attempting to sell it short.  It could double from here, just as easily as it could fall by half.” 

Others believe that Bitcoin’s success and soaring value represent a repudiation of the weak U.S. dollar.  It’s no coincidence that Bitcoin’s popularity has greatly increased in the wake of the gold bear market; Bitcoins have apparently supplanted the yellow metal as a safe haven du jour among libertarians and others worried about a potential dollar collapse. 

Evaluating the Bitcoin’s value is a difficult task.  Regardless of the metric, whether fundamental or technically based, analysis of Bitcoins is a tall order without something with which to make relative comparisons.  The lack of long-term historical price data is another impediment to making informed risk assessments regarding Bitcoin’s future.  David Woo, currency strategist at Bank of America Merrill Lynch, recently published a valuation report on Bitcoin.  He valued the digital currency at $1,300, cautiously adding that this number is based on several assumptions that can’t be firmly quantified. 

Woo concluded that the rapid growth of the digital currency’s value “would suggest the price appreciation has been more about Bitcoin as a store of value or investment than as a medium of exchange.”  He also noted that Bitcoin transactions have diminished as the coin’s price has increased.

An examination of the Bitcoin “long-term” chart is revealing.  Any market technician worth his salt will preface an analysis of this chart by pointing out that, aside from transaction volume, there is little data with which to make an informed forecast other than price itself.  That said, a classical chart pattern analysis suggests there is more upside in the coin’s future before the bull market in its value comes to an end.  The breakout to new highs in Bitcoin’s price which occurred in November was preceded by six months of base-building; in classical chart analysis this is normally a good indication of a significant upside run ahead.  Below is a weekly chart for the Bitcoin, courtesy of www.bitcoincharts.com.


As a speculative medium, Bitcoin is an undisputed success.  As a medium of exchange, the currency has been less than ideal.  The serious shortcomings of Bitcoin as a dollar substitute were chronicled in an amusing article by Jessica Roy in a recent issue of Time magazine.  As she pointed out, “Very few brick-and-mortar stores actually accept bitcoins today.”  And for the ones that do, the transactions can be exceedingly complex and time consuming. 

While there may be additional upside ahead for Bitcoin’s value in the intermediate term, the ultimate fate of Bitcoin is likely to be that of every other dollar hedge we’ve seen in recent years, namely a collapsed value.  

Returning to our analysis of the dollar, while the dollar index has been weak in recent months there is reason to believe we’ll see a meaningful rally at some point in 2014.  If expectations of a stock market melt-up and subsequent melt-down is realized it will almost certainly be accompanied by a major dollar rally owing to investors’ needs to get liquid.  Moreover, since the end of the credit crisis dollar rallies have been bi-annual affairs and since 2013 was mostly a down year for the dollar, 2014 should see a rally assuming this relationship remains alive.

Monday, December 16, 2013

Is it 1929 all over again?

A growing number of market technicians, some of them highly respected, are forecasting a sharp correction in the January-February time frame.  In light of a number of recent inquiries I’ve had regarding this possibility, let’s examine this topic.

Tom DeMark is one of Wall Street’s most esteemed technical analysts.  He recently uncovered an analog between the current stock market and the run-up to the 1929 top.  Tom McClellan published a chart comparing the two markets in a recent article.  The theory behind price pattern analogs is that “similar market conditions can produce similar patterns” as McClellan put it. 

One problem with comparing stock market patterns from different periods is that the underlying conditions behind the patterns are often dissimilar.  For instance, the run-up to the 1929 high was fueled by widespread speculation from the general public.  Today the public is a virtual non-participant in the market’s run-up to new highs.  Also, as McClellan himself points out, the Federal Reserve consistently raised the benchmark interest rate several times leading up to the 1929 crash.  Today, of course, the Fed funds rate is hovering near zero percent. 


Technicians like DeMark and McClellan who foresee a market top in mid-January base their prediction not just on various technical disciplines, but on a more mundane set of reasons.  For instance, next month is when the current congressional agreement on the debt ceiling comes up again for discussion, which in turn could cause investors to reassess their enthusiasm.  Concerns over health insurance policies and the implementation of the Affordable Care Act could be another investor concern around mid-January.  This is what the technicians who argue in favor of a January top believe at any rate.

Another consideration for the projected mid-January top is found in the following words of McClellan:  “The Fed is not likely to yank away the punchbowl at its Dec. 17-18, 2013 meeting, just a week before Christmas, but the Jan. 28-29, 2014 meeting is a greater possibility for finding out that the markets may have to start to quit the QE addiction.  And the FOMC's March 18-19 meeting fits right about where the Black Thursday crash of 1929 fits into this analog.”

My assessment of the mid-January top scenario is decidedly different from that of the above mentioned technicians.  There are several key short- and intermediate-term cycle peaks scheduled for January, culminating with a Feb. 21 cycle cluster on the Kress cycle calendar.  This makes it possible a sharp correction beginning in January and lasting into later February, but without a specific catalyst a crash is exceedingly hard to predict.

Certainly the market's internal momentum is deteriorating, but that alone isn’t sufficient to expect a major crash.  In order to have a sharp sell-off like the one DeMark, McClellan, et al predict we'd likely need to see a major worry – probably news-related – take center stage early next year. 

Another consideration for a significant market decline in 2014 is the “melt-up” scenario discussed by economist Ed Yardeni and others.  Should the stock market continue its advance unabated into Q1 2014, conditions may well be ripe for a major top by the end of the next quarter.  The weekly configuration of Kress cycles would support this, not to mention the coming final “hard down” phase of the longer-term yearly cycles scheduled to bottom in late 2014. 


The only other ingredient necessary is greater public participation in the stock market.  Michael Sincere of MarketWatch.com touched on this in a recent column.  He asks where are the “intoxicated investors, a buying frenzy, over-the-top speculation, and a get-rich-quick mentality?”  He rightly points out that these are necessary accompaniments to a market bubble.  

A continued rally to new highs, however, will likely solve this “problem” by forcing sidelined investors into becoming market participants for fear of missing the proverbial “only game in town.”  Thus as we’re about to enter 2014 the stage may be set for a final melt-up stage to set up a crash later in the year.  

Friday, December 13, 2013

Kress cycles Q&A

A client writes: “Clif, do you have any views on debt levels and currencies?  How much is the weakening US dollar impacting on the US economy?  It just seems strange that in the best performing advanced global economy that its currency should continue to weaken.  What of the possible melt up taking the stock market all the way up to the Sep./Oct. 2014 time period whilst under deflation and then selling off when a new 60-year cycle starts in 2015 with rising inflation?  I am assuming inflation won’t be good for stocks a' la 70’s rising yields.”

Answer:  I'm not sure that the weakening U.S. dollar is having as much of a negative impact on the economy as it did, say, in the years leading up to the credit crisis.  At that time the falling dollar was adding to the upward pressure on commodity prices, particularly oil, which put strain on the economy and fed into the crisis.  This time around commodity prices are relatively low; in fact many commodities seem to be ignoring the dollar weakness and are still in decline -- including gold.

One could also make the case that a weak dollar is part and parcel of the Fed's QE3 program.  Some have even called QE3 a de facto weak dollar policy.  It's clearly been a boon for equity prices and may have done more help than harm this time around. 

As for the years after 2014, it's hard to predict exactly how a continued weak dollar might impact the economy.  My guess is that it will take a while for inflationary pressures to build – possibly a few years – so there could be room for additional dollar weakness before it weighs on the economy.

Thursday, December 12, 2013

Just how bad is the economy?

A common refrain heard among pundits is that the Fed’s QE stimulus program has done little, if anything, to boost the economy. 

No one denies the extent to which QE has sent stock prices soaring in the last five years, yet in that same amount of time the domestic economy has made but scant progress.  Or so goes the cliché.  There is good reason for believing, however, that the economy has seen more internal improvement than critics would like to admit.

So just how much as QE helped the economy?  A recent report by the McKinsey Global Institute, as mentioned in the Momentum Strategies Report, estimated that “unconventional monetary policies” such as asset purchases and low interest rates have reduced the unemployment rate by at least 1 percent and have prevented a deflationary spiral in the U.S.

Consumer confidence, while certainly below the high levels of the pre-crisis years, has come a long way since the depths of 2009.  It reflects a steady improvement in how consumers perceive their own economic prospects and is a testament of recovery.


Another clear testament of economic recovery is the New Economy Index (NEI), a reflection of the real-time state of the U.S. retail economy.  NEI recently hit a new all-time high and continues trending higher.  As long-time readers of this column are aware, until NEI confirms a “sell” signal the overall trend of retail spending is considered to be up.  The last time NEI gave a “sell” signal was in early 2010, which proved to be a temporary blip in the long-term recover that started in 2009.


There are many who wonder why, with untold billions in stimulus money, the economy hasn’t recovered more than it has by now. There are three answers to this; the first answer is that given the severity of the 2008 credit crash it was only natural that recovery would be prolonged.  After all, the previous Great Depression in the 1930s took over a decade to get the economy moving again.  This time around the unprecedented scope and pace of the Fed’s stimulus shortened the depth of the recession and improved the recovery time.   

The second answer is that the 60year/120-year Kress cycle has been in its final “hard down” phase for the last few years.  This has created a deflationary undercurrent in the U.S. economy; it partly explains why the Fed can get away with creating so much money every month without it leading to massive inflation, as it would normally. 

A third and more revealing answer is that the consumer spending component of the recovery has actually done better than the statistics suggest.  Raymond James economist Jeffrey Saut discussed this in a recent commentary, noting that “the majority of [consumer] transactions are taking place for cash, where sales are not as readily captured in the surface figure as are credit-card purchases.  Indeed, not only are the foreigners transacting in cash, but many Americans are doing the same after having been burned by debt in the 2008-09 credit crisis.”  Saut’s conclusion is that the economy is stronger than most believe. 

This isn’t the complete story, however.  Most of the increased spending and subsequent economic strength is courtesy of upper-middle class and wealthy consumers.  The middle class still hasn’t fully recovered from the Great Recession, and there is some evidence that segments of the middle class are still experiencing something akin to a recession.  The way a recovery normally progresses is that the wealthier segments of the population are the first to emerge from an economic contraction with increased spending.  Then the classes beneath them slowly start spending again as the job market improves and with it their fortunes.  

It’s clear that the U.S. middle class has yet to fully participate in the recovery, but their participation should be evident by 2015 once the deflationary undercurrents of the Kress cycle have been dissipated. 

Wednesday, December 11, 2013

Has the long-term cycle bottomed early?

A reader asks, “I was wondering if it’s possible that the long cycles, such as the 60-year cycle, have already bottomed early.  Is that even a possibility within the scope of the cycles?  It appears that the Fed has complete control of the markets right now.   One cannot help but wonder how high they will drive the stock market, and how low they will drive the gold miners.  It would seem that the imbalances are beginning to look a little conspicuous.”

This is a question many investors are asking themselves right now, so let’s delve into it. 

It’s important to note that the 60-year cycle that was referenced above is “fixed” as opposed to dynamic.  This means that its bottom is absolute and can't be moved beyond its standard deviation of roughly 1-2 months.  Therefore it hasn't bottomed yet and won’t bottom until later next year, as per the norm of a yearly Kress cycle.

Now is it possible that the Fed’s extraordinary stimulus efforts in recent years have mitigated the cycle?  Yes it is.  Historically the last 60-year bottom of 1954 saw a similar situation wherein the Great Depression of the preceding decades – and the U.S. government's response to it (namely war-time spending) – essentially ended the depression/bear market a few years before it normally would have ended under the Kress cycles.  

It would be quite a stretch to assert the Fed has complete control of the market.  Yes, it does exercise a rather large degree of control over equities through QE, but when you consider how historically “oversold” the market was in the wake of the 2008 crash the subsequent rally isn’t surprising.  

A greater feat would be if the Fed could prevent another market “melt-up” from occurring.  It’s doubtful the central bank has the prescience to do this, so we may yet see a final sell-off before the 60-year cycle bottoms next year.

Thursday, December 5, 2013

The Kress cycle and the fate of the middle class

Just how much pain has the middle class suffered in the last four years?  The data is quite conclusive: the pain has been harsh.

According to government statistics, wages for the middle class have shrunk appreciably in the past decade.  The Census Bureau points out that the typical middle class household made $51,017 this year, roughly the same as the typical household made a quarter of a century ago.  Adjusted for inflation, that’s a decline in living standards too big to ignore.

Providing further insight into the middle class plight, in 2010 the U.S. Commerce Department published a report about what it would take for different types of families to reach the historical U.S. middle class — which it defined as a house, 1-2 vehicles, an annual vacation, decent health care and enough savings to retire and contribute to the college education of one’s children.  Its conclusion was that the middle class has become much more exclusive than it used to be.  “Even two-earner families making almost $81,000 in 2008 — substantially more than the family median of about $51,000 reported by the Census — would have a much tougher time acquiring the attributes of the middle class than in 1990,” one analyst concluded.

Additional perspective on the growing gap among the classes can be found in a 56 percent jump in the cost of housing since 1990, a 155 percent leap in out-of-pocket spending on health care and the double-digit increase in the cost of college.  “Either we define the middle class down a couple of notches,” stated one reporter, “or we acknowledge that the middle class isn’t in the middle anymore.”

The doleful plight of the middle class has been a recurring theme among journalists for much of this year.  Just this week, for instance, the Washington Post highlighted a speech by President Obama which emphasized the “dangerous and growing inequality” between America’s highest earners and the rest.  The president’s speech was rich with platitudes but poor on solutions. 

To take another recent example, Rana Foroohar, writing in the Dec. 2 issue of Time, opines that despite an abundance of monetary liquidity, “we have a real-economy-growth problem.”  Foroohar acknowledges that the Fed’s monetary policies have benefited the top quarter of American households, which hold most of the country’s equity assets.  Yet “they have done much less for the rest,” she contends, “people who continue to struggle with flat wages and higher than normal unemployment.”  Boston Fed President Eric Rosengren admitted as much when he stated, “If you don’t have a house or stock, you don’t benefit as much” from QE.


The need to do more to stimulate the economy and revive the middle class has been the excuse behind attempts at actually increasing monetary stimulus.  Former Treasury Secretary Larry Summers, in a recent speech before the International Monetary Fund, warned that the U.S. might be stuck in a “secular stagnation.”  He suggested that this slump isn’t a result of normal business cycles but could be a potentially permanent condition.  The solution he offered to “fix” this problem was the introduction of negative interest rates by the Fed. 

Others have picked up on this theme.  Miles Kimball, an economist at the University of Michigan, has suggested placing sharply negative interest rates on bank deposits, which is tantamount to charging customers for keeping money in the bank.  “Paper currency could still continue to exist,” Kimball was quoted as saying in the Dec. 1 issue of Businessweek.  “But prices would be set in terms of electronic dollars (or abroad, electronic euros or yen), with paper dollars potentially being exchanged at a discount compared to electronic dollars.”  Theoretically this would put pressure on consumers to spend before their money loses value, thus providing a boost to the economy according to this line of thinking. 

While economists offer up schemes to get the average consumer buying again, the underlying cause of the problem continues to be ignored.  An overlooked factor behind the decline of the middle class is the long-term economic rhythm, or Kress cycle.  The 60-year cycle of inflation and deflation provides an almost perfect parallel of the middle class plight since 1954.  When a new 60-year cycle took off in 1954, so did the fortunes of a majority of Americans.  The 60-year cycle is divided into two 30-year cycles.  The first half of the 60-year cycle is typically inflationary and is conducive to rising wages and an increasing standard of living.  The second half of the cycle is at first disinflationary, then deflationary. 

By examining the current 60-year cycle which began in 1954 one can easily see that the first 30-year period from ’54 until 1984 was a time of expansion for the middle class.  Probably no greater period of unbridled economic success has been experienced by most Americans than during this period.  By contrast, the period from 1984 until 2014 – when the cycle bottoms – has been one of declining economic fortunes, especially the last 10 years.

It was Machiavelli who said that when a problem becomes so big that everyone can see it, the time for remedies has passed.  The problem of the shrinking middle class can’t be solved by direct political action; the time is much too late for such remedies.  The only possible hope for revival is a resurgent economy in the years following next year’s 60-year cycle bottom. 

It is worth noting that Mr. Kress, the namesake of the cycle, himself didn’t believe that the upcoming 60-year cycle bottom would result in a meaningful resurgence of the middle class.  Instead he predicted the further establishment of socialist political policies aimed at increasing, not decreasing, economic inequality among the classes. 

Kress also referred to his long-term cycle as a “Revolutionary Cycle,” pointing out that the bottom of this cycle frequently coincides with the advent of major social/military/economic revolution.  Kress emphasized that the Industrial Revolution which gave birth to the U.S. middle class was a product of the long-term cycle bottom of 1894.  Many commentators believe that a global economic empire, or world government, will become a reality within our lifetime.  The words of author Felix Markham in his seminal work, “Napoleon,” provide context to this line of thought.  Speaking of Napoleon’s attempt at creating a world empire, he wrote:

“But it is hardly conceivable that the…world empire which appeared to be within his grasp could have lasted more than a few years.  The forces at work in Europe [in the 19th century] would have shattered it into fragments – the rise of the middle class, fostered by Napoleon as the basis of his power, and soon to be immensely accelerated by the spread of the industrial revolution.  And it was this class which was to be the spearhead in the demand for national self-determination and parliamentary government.”

In other words, Markham is saying that a strong middle class is inimical to a highly centralized autocratic, or socialist, government.  Within this context the decline of the U.S. middle class may be considered by the ruling class as an expedient toward greater political centralization. 

In the final analysis, the problem of the shrinking middle class is so extensive and entrenched that any political solution is likely to be ineffective.  The time for remedies is when a problem is still in its infancy; when it has become entrenched the trend must be allowed to run its course, at the end of which the problem will terminate and thereby create its own solution through the process of time.  Economic trends are products of the long-term cycles and attempts at forcing cures to a problematic trend usually succeed only in exacerbating the problem.  The best that the middle class can hope for is that time itself will work out a solution agreeable to its survival.

Wednesday, December 4, 2013

Bubbles, bubbles everywhere

A couple of weeks ago we looked at a recent cover of Barron’s, which featured a picture of a giant bubble.  The cover story asked the rhetorical question of whether there was a bubble in the financial market. 


Indeed, the bubble vigilantes are out in full force which suggests a full-fledged financial market bubble hasn’t fully developed.  On the front cover of Nov. 18 Barron’s, the editors ask the question of whether or not equities are in a bubble.  Their answer: “Yes, in some tech names and new issues” and “No, in most other shares.”  The Barron’s cover very much underscores the heightened sensitivity to developing bubbles, which in turn keeps investor sentiment from becoming too ebullient before the final melt-up stage of the bull market.

With each passing week we see that a growing number of pundits and analysts remain on high alert over the development of a potential asset price bubble.  Bubble predictions have mainly been focused on stocks and real estate.  To just one example, The Washington Post blog published this headline on Monday: “These 17 countries may have housing bubbles.  If they pop, God help us all.” 

Behind this gloomy prediction is none other than Nouriel Roubini, the ultra-bearish economist who correctly forecast the global financial crisis six years ago.  Roubini doesn’t mention the U.S. in his list of bubble-prone countries but he believes that the large list of countries with frothy real estate markets could contribute to a global economic collapse on the order of the 2008 crash. 

According to Roubini, most major countries (excluding the U.S., southern Europe, Russia and Africa) are experiencing something akin to a real estate bubble due to cheap credit.  Should the bubbles begin to burst in the coming months the consequences to the global economy could be fatal.

Yet another high-profile prognosticator to engage in bubble-speak lately is Robert Shiller, the Nobel Prize winning economist.  Shiller has made countless forecasts in the financial press in recent years with mixed results.  His most vocal predictions are those dealing with a repetition of the 2008 financial market drama, and the popular press is all-too happy to publicize them. 

Shiller was at it again this weekend, warning of a U.S. stock market bubble.  He told Der Spiegel, “I am not yet sounding the alarm.  But in many countries stock exchanges are at a high level and prices have risen sharply in some property markets.  That could end badly.”  He added that he was most worried about the boom in equity prices because he believes that the U.S. economy is “still weak and vulnerable.”  He described the financial and technology sectors as “overvalued.” 

The growing number of bubble-related headlines was enough to warrant the conclusion I wrote in the Nov. 18 issue of Momentum Strategies Report:  “The Barron’s cover very much underscores the heightened sensitivity to developing bubbles, which in turn keeps investor sentiment from becoming too ebullient before the final melt-up stage of the bull market.”  In other words, as long as the financial press remains on “bubble alert” the chances of a massive market bubble are diminished. 

There may well be something to fear of Roubini’s global real estate bubble warning in 2014.  For that matter, perhaps even Shiller’s prophecy for U.S. equities will be fulfilled next year.  For the foreseeable future, however, the still-high level of investor caution and “bubble-phobia” should be enough to prevent the collapse that the Cassandras fear. Only when investors’ guard is relaxed do we need to worry about the detrimental effects of collapsing bubbles.  For now there appears to be enough concern to prevent the type of scenario the bubble-mongers are trying to conjure up, at least in the near term.

Note: By popular request I’ve provided an explanation of the weekly Kress cycles in my latest book, Kress Cycles, which explains the weekly Kress cycles in depth.  It's now available.

Wednesday, November 27, 2013

Why gold and silver hate easy money

Ben Bernanke recently provided some clarity to the confusion surrounding the Fed’s QE stimulus program.  He indicated that the near-zero Fed Funds rate will likely remain at that level long after ending asset purchases under quantitative easing (QE).  This satisfied Wall Street and provided much relief, allowing a mini-rally to transpire in equities but providing additional selling pressure for gold and silver. 

Thus the inverse relationship between gold and the stock market continues to hinge on the assurance of easy money courtesy of the central bank.  While many precious metals analysts continue to insist that gold will benefit from QE, the evidence is quite clear that the opposite is the case.  Stocks are the clear beneficiaries of loose money and investors have exited the safe havens of recent years, namely gold and Treasuries, in favor of equities this year.  Until the massive liquidity provided by the Fed is in any way reduced, gold and silver will likely continue to have a tough go of it.

As Fed watchers have pointed out, both Janet Yellen, the Fed governor nominee, and Fed member Charles Evans have no plans to reduce the stimulus.  “Current low inflation numbers and diminished credit demand suggest a moderate recovery,” as one economist pointed out.  The economic recovery theme is ironically the biggest obstacle facing the yellow metal at present.  Fear and uncertainty are the two catalysts which gold feeds upon, and indeed these two widespread investor emotions kept gold in a strong uptrend until the summer of 2011. 

As I noted in a previous commentary, however, an economic slowdown in Asia and/or Europe would have profound consequences for the global economy and would be a definite stimulus for a return to gold among safe haven investors, and a return of economic volatility in 2014 would therefore almost certainly harbinger a revival of interest in gold as a safe haven investment.

According to the CFTC, combined net gold positions by money managers were down by some 37 percent for the week ending Nov. 12, led by a 104 percent increase in short positions.  While gold futures fell 24 percent this year, the MSCI developed world equity markets index rose close to 24 percent.  Sharps Pixley points out that the worldwide gold-backed ETF holdings tracked by Bloomberg have continued to fall, declining 0.5 million troy ounces in November and 24.6 million troy ounces year-to-date.  “So far, various sources support that most of the gold liquidated from the ETFs have been re-melted into gold bars and sent to China,” writes Sharps Pixley.

December gold underperformed this week following the “death cross” technical signal that has been widely discussed by analysts.  Gold broke below the technical significant $1,268 level on a closing basis and is now in the hands of the sellers in the immediate term.  Chart measurements suggest a low between the $1,180-$1,200 levels can’t be ruled out before the latest decline bottoms out in the short term.  Keep in mind that gold’s technical path of least resistance is down as long as it remains below the declining 15-day moving average.

Meanwhile silver continued its recent slide by closing at $19.90 on Thursday.  Further additional downside is possible to the $18.00-$18.50 area where the lower boundary of a wedge pattern intersects in the weekly chart.  Silver’s immediate-term trend is also down below the declining 15-day moving average, a tool which has done an admirable job of capturing most of the immediate-term trend in recent months.

Goldman Sachs released a research report this week revising its 2014 forecast for gold.  The investment bank said the yellow metal could drop as much as 15 percent next year due to the increased downward pressure facing commodities because of accelerating U.S. economic growth.  Of the major financial institutions, Goldman is one of the few that has the correct understanding of the relationship between gold and the economy/monetary situation, IMO.  Let’s also not forget that Goldman Sachs, which often moves the market based on the sheer weight attached to its forecasts by investors.

Tuesday, November 26, 2013

U.S. retail sales still bullish

This week is shortened by the U.S. Thanksgiving holiday which will likely contribute to diminished trading volume as the week progresses.  Price movement is also likely to be relatively narrow and confined to recent highs and lows, although a push to a nominal new high in the Dow and S&P indices can’t be ruled out.  

The real action is likely to begin next week after the holiday when traders return to focus their full attention on the retail sales outlook for December.  The results of this year’s “Black Friday” week ending Nov. 30 will set the tone for next week….

Speaking of retail sales, here’s what our New Economy Index (NEI) looks like as of Friday, Nov. 22.  This index is a composite of the leading consumer retail and business service stocks – such as Amazon and FedEx – and is an accurate real-time reflection of the U.S. retail economy. 


As you can see, the NEI is at an all-time high as of last week which means the retail economy is still expanding.  NEI hasn’t given an economic “sell” signal since early 2010 and obviously won’t give another sell any time in the next few weeks.  Extrapolating the trend of this indicator suggests that the critical holiday shopping season will be a good one for retailers.  [Excerpted from the Nov. 25 issue of Momentum Strategies Report]

Friday, November 22, 2013

Why gold and silver are having a tough time

Ben Bernanke provided some clarity to the recent confusion surrounding the Fed’s QE stimulus program.  He indicated on Tuesday that the near-zero Fed Funds rate will likely remain at that level long after ending asset purchases under quantitative easing (QE).  This satisfied Wall Street and provided much relief, allowing a mini-rally to transpire in equities but providing additional selling pressure for gold and silver. 

Thus the inverse relationship between gold and the stock market continues to hinge on the assurance of easy money courtesy of the central bank.  While many precious metals analysts continue to insist that gold will benefit from QE, the evidence is quite clear that the opposite is in fact the case.  Stocks are the clear beneficiaries of loose money and investors have exited the safe havens of recent years, namely gold and Treasuries, in favor of equities this year.  Until the massive liquidity provided by the Fed is in any way reduced, gold and silver will likely continue to have a tough go of it.

On the supply/demand front, the latest report from the World Gold Council revealed that consumer demand for gold in jewelry, bar and coin form increased 26% in the first three quarters of 2013 compared to last year.  Consumer demand, however, was more than offset by ETF divestment along with clampdown on gold by India’s government.  Barclays meanwhile pointed out that the market surplus for gold is at its widest since 2005 due to decreased demand.   

According to Numismatic News, a new record was reached Nov. 12 for sales of silver American Eagles.  The U.S. Mint said total purchases had reached 40,175,000.  This surpassed the previous record high set in calendar year 2011 when 39,868,500 were sold.

“Silver Eagle demand is now snapping up four times the number of coins that were sold by the Mint in 2007, before the economic crisis upended the financial world,” according to Numismatic News.  “Sales in 2007 were 9,887,000 pieces, which was still below the 1987 production record of 11,442,335 pieces.”

By comparison, in 2008, sales doubled to 19,583,500 as panic fueled demand for hard assets.  In 2009, when the stock market was bottoming out, silver Eagle buyers stocked up on 28,766,500 coins, roughly 50 percent higher than the prior year, according to Numismatic News.

Let’s try and put the latest silver coin numbers in perspective.  Investors were correct to snap up silver bullion coins during the bottoming phase of the credit crash between October 2008 and March 2009.  From a monthly closing low of $8.40 in October 2008, the silver futures price rose to a high of almost $50 in April 2011 before peaking.  From there the price of silver has been in a downward trend for the last two-and-a-half years.  Essentially, the buyers were right during the first two-and-a-half-year rally but have been wrong to keep buying silver coins in the last two-and-a-half-year decline. 


With the silver market in a confirmed downtrend, the path of least resistance is down and the market is more sensitized to bad news than to good news.  That means that any negative news developments for silver – which also includes bullish news for the stock market – will likely be used by sellers as a catalyst to keep the silver downtrend intact.  In other words, lower silver prices are a higher probability for now.  Until the pattern of declining tops and bottoms is decisively broken, we have to assume the silver bear market remains intact.  Until the bear market in silver has a confirmed ending, why purchase large amounts of physical silver when the price could end up going lower?  Trying to time the bottom is a tempting preoccupation with individual investors, but in most cases it ends up being a costly mistake. 

If silver is poised to begin a new bull market in 2014 the market will surely give us ample time to make new long commitments without leaving us behind.  There is, after all, a lot of ground to cover before a new upward trend can be established and there’s also a lot of overhead supply to be dealt with before a new bull market commences.  

Another factor to consider is that if silver does end up making a lower low in the coming weeks, there’s always a chance that many of these silver Eagle purchases will be dumped onto the market in the form of panic selling, thereby resulting in even more selling/supply pressure.  Bottom line: let’s wait for the market to signal its intent before jumping on the silver bullion bandwagon.  

Monday, November 18, 2013

The “melt-up” scenario for 2014

Market mavens have increasingly turned their talk to a possible “melt-up” scenario in the stock market.  The big fear entering 2014 is that another runaway freight train-type stock market, like the one preceding the 2008 crash, is gathering momentum.  The latest comment by incoming Fed president Janet Yellen only added to that speculation.

Yellen stated last week that, based on current valuations, stocks aren’t “in territory that suggest bubble-like conditions.”  Her lack of concern is one reason for thinking that the equities could be on the verge of a melt-up.  Economist Ed Yardeni has made the case for this potential scenario playing out, especially if Yellen turns out to be more dovish than Bernanke as he expects. 

There are two principle drivers behind the melt-up scenario: the first is the so-called “reach for yield” among investors that Yellen herself alluded to in her latest remarks and which has resulted in a veritable bubble for corporate and emerging market debt issuance.  The second is the unprecedented monetary policy of the Fed in its frenzied efforts to beat deflation and lower unemployment. 

Emerging market debt suffered a temporary setback in the wake of the “tapering” talk and debt ceiling limit debate earlier this summer.  Since then, however, emerging market bonds have rebounded and there is a growing conviction among savvy investors that this sector is precariously close to being over-inflated.  It’s not there yet, but it appears to be headed in that direction and that’s one of the potential catalysts to an early 2014 melt-up scenario.

Corporate bond issues have risen to a record $6.1 trillion as of the second quarter of 2013, according to Federal Reserve statistics.  This translates to an increase of $625 billion year over year.  Moreover, as Yardeni points out, corporations are likely using some of their bond sale proceeds to repurchase shares of their companies, which artificially inflates earnings per share.  “That’s a bubble-like development if stock prices are getting a significant lift from debt-financed share buybacks rather than actual earnings growth,” Yardeni wrote.


But short sellers beware: we’re not there yet.  The bubble vigilantes are out in full force which suggests a full-fledged financial market bubble hasn’t fully developed.  On the front cover of the latest issue of Barron’s, the editors ask the question of whether or not equities are in a bubble.  Their answer: “Yes, in some tech names and new issues” and “No, in most other shares.”  The Barron’s cover very much underscores the heightened sensitivity to developing bubbles, which in turn keeps investor sentiment from becoming too ebullient before the final melt-up stage of the bull market.


Assuming the market does start melting up in the coming weeks and months, the final outcome is easy enough to predict: a market crash.  The fact that the 120-year cycle is in its final “hard down” phase next year would only add impetus to the crash following a breath-taking rally to new highs.  Accordingly, investors should prepare for this possible scenario in 2014.